
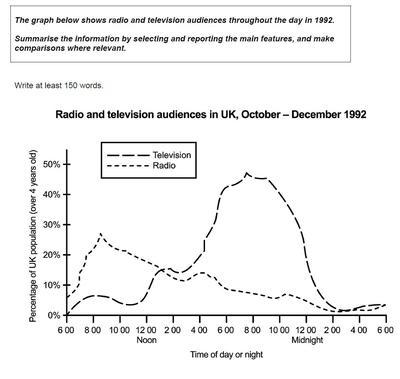
The graph gives information about the differences in the number of people who watched TV or listened to the
radio
throughout the day in 1992.
Use synonyms
Overall
, the top used device in 1992 was television, Linking Words
while
the Linking Words
radio
was used half as much.
Turning to the details, almost 30 per cent of British people used to listen to the Use synonyms
radio
in the morning, which shows that they prefer to listen news only at the beginning of the day. Use synonyms
However
, the number of Linking Words
radio
audiences Use synonyms
is
Unnecessary verb
apply
then
, steadily declined.
In comparison, the amount of television spectators fluctuated from 6 am to 4 pm and Linking Words
then
, gradually increased. At 8 pm Linking Words
this
quantity reached a peak with 50 per cent of viewers. Linking Words
Next,
since 10 pm it is obvious that TV showed a downward trend and hit the lowest point at 2 am. Between 2 and 6 am neither televisionLinking Words
,
nor the Remove the comma
apply
radio
was used.Use synonyms