
The graphs provide the data collected after a
survey
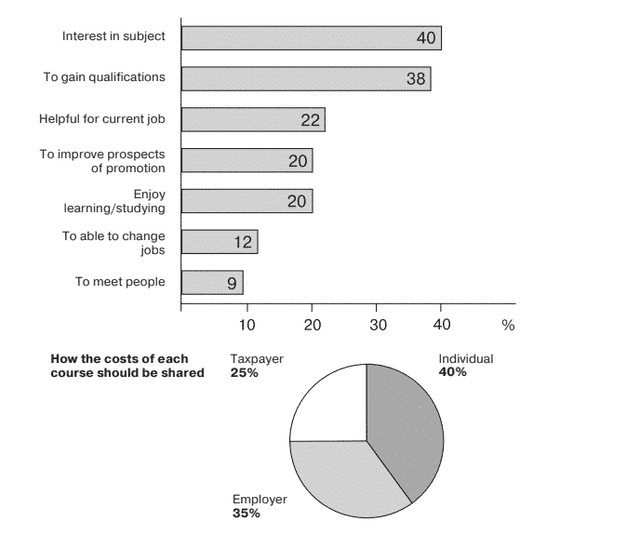
was conducted on youth education. The charts illustrate the reasons for studying and how the cost of the Use synonyms
course
should be shared Use synonyms
according to
Linking Words
survey
respondents.
Use synonyms
Overall
, what stands out the most from the information given is that a major proportion of the students were studying either to gain a qualification or because they were curious about the subject and a tiny percentage of adults joined a Linking Words
course
to meet new Use synonyms
people
. Use synonyms
Furthermore
, Linking Words
people
considered that more than half of the Use synonyms
course
fee should be contributed by taxpayers and employers.
Approximately 40% of adults were studying because they were interested in the Use synonyms
course
. Use synonyms
Similarly
, it was 38% for the youth who just wanted to gain qualification. The proportion of the Linking Words
people
who wanted to switch careers was 12% Use synonyms
along with
that 9% of the Linking Words
survey
respondents were enrolled in a particular Use synonyms
course
to meet new Use synonyms
people
. The percentage of the individuals who were studying because their job demanded it was almost similar.
Use synonyms
Additionally
, the Linking Words
survey
results show that Use synonyms
people
considered that education expenses should Use synonyms
also
be contributed by taxpayers and employers i.e. 25% and 35% respectively. The remainder can be covered by the students themselves.Linking Words