
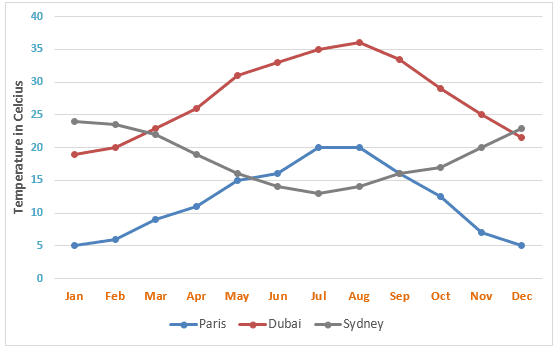
The provided diagram illustrates the percentage of average temperatures for each month across three diverse cities,
Paris
, Use synonyms
Dubai
and Sydney. The temperatures Use synonyms
is
displayed in Change the verb form
are
Celsius
degrees.
Use synonyms
Overall
, it is clear from the line graph that Linking Words
Paris
and Use synonyms
Use synonyms
Dubai
Change noun form
Dubai's
temperature
significantly rose Fix the agreement mistake
temperatures
during
April to August Change preposition
from
while
in, contrast Sydney's temperature dramatically fell at the same time.
Observing the details, it is remarkable that Linking Words
Paris
has a colder atmosphere than the rest two, Use synonyms
Paris
started at 5 Use synonyms
Celsius
in January Use synonyms
then
gradually climbed to reach its peak at 20 Linking Words
Celsius
in July and remained the same in August Use synonyms
then
dropped to 5 Linking Words
Celsius
again Use synonyms
at the end
of the year. Linking Words
Similarly
, Linking Words
Dubai
experienced both fluctuations of increased and decreased, Use synonyms
Dubai
began at approximately 18 Celcius surprisingly soared to 35 Use synonyms
Celsius
in August and slowly fell to 22 Use synonyms
Celsius
in December.
Use synonyms
On the contrary
, Sydney started around 25 Linking Words
Celsius
Use synonyms
then
met the reduction in July by 13 Linking Words
Celsius
and steadily rose to 23 Use synonyms
Celsius
Use synonyms
at the end
.Linking Words