
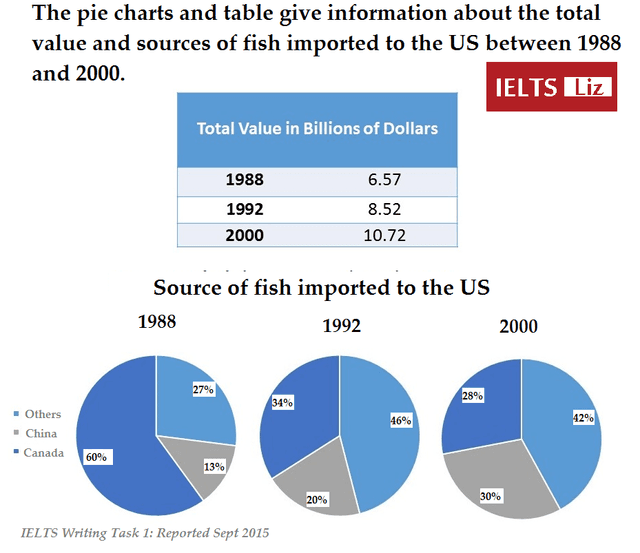
The charts above illustrate the major providers and the annual number of seafood provided in the United States between 1988 and 2000 years.
Overall
, it can be clearly seen that the sum of fish has increased only more every year. There are main sources, Linking Words
such
as Linking Words
China
, Use synonyms
Canada
and others.
It is worth noticing that in 1988, the total amount was 6.57 billion dollars. Use synonyms
While
the leadership was taken by Linking Words
Canada
with more than half, Use synonyms
China
and others have taken only 13% and 27% respectively.
1992 saw significant growth to roughly 8.5 billion, Use synonyms
moreover
, other countries' rate rose to the biggest with just under half. On top of that, Linking Words
China
experienced a climb to the fifth of the diagram, Use synonyms
also
there was a dramatic decline for Linking Words
Canada
to 34%.
Use synonyms
Finally
, in 2000 ,the quantity accounted for 10.72 billion, groups of the regions have still been the most with a small decrease to 42%. Linking Words
Furthermore
, Linking Words
China
witnessed again a tiny rise to the third ,as Use synonyms
Canada
went down to almost the thirdUse synonyms