
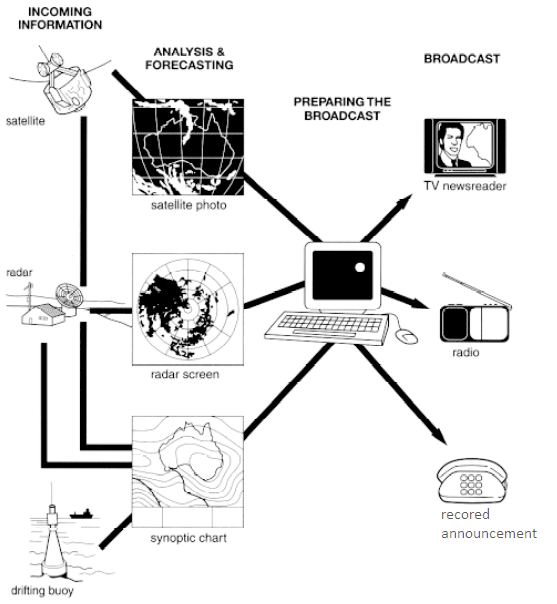
The provided flowchart depicts the process of gathering real-time data by the meteorology department of Australia
,
so that accurate weather predictions are produced.Remove the comma
apply
Overall
, the working of the forecasting system involves four important processes encompassing various elements at each step, all of which work together to provide reliable weather updates to Linking Words
the
Australian citizens.
Correct article usage
apply
Firstly
, incoming signals from the radar, satellite and drifting buoy Linking Words
is
collected.Correct subject-verb agreement
are
Secondly
, the analysis of data received from these sources is done in the Linking Words
further
step i.e. analysis and forecasting which comprises evaluating the satellite pictures taken from the satellites, analysing the radar screen and reading the synoptic chart.
Linking Words
Next,
all of these are processed and prepared in the third step which is preparing and broadcasting Linking Words
this
information by using a computer system. Linking Words
Lastly
, the weather forecast is broadcasted using various modes Linking Words
such
as TVs, radios and recorded announcements. After all of Linking Words
this
is done the listeners and the viewers can get authentic meteorological Linking Words
forecast
.Fix the agreement mistake
forecasts