
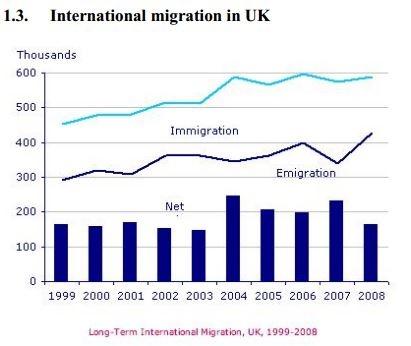
The chart depicts the data of immigrants and emigrants in the UK between 1999 and 2008.
Overall
, Linking Words
it is clear that
the number of immigrants gradually increased until 2004 and reached its peak in 2006. Linking Words
In contrast
, there is a fluctuation in terms of the amount of emigration during the nine-year period before it climbed to its climax by the end of the reporting year.
Focusing on the incomers moving to the UK, at the beginning of the report, there were roughly 450 Linking Words
thousand
settlers. Use synonyms
Thereafter
, the trend began to surge moderately from 2000 and 2003 and experienced a significant jump to nearly 600 Linking Words
thousand
people in 2004, making it the year with the highest net newcomers. Use synonyms
Although
there was a sudden drop in 2005, the figure Linking Words
finally
hit its peak in 2006 with 600 Linking Words
thousand
newcomers recorded.
Moving on to the emigration, there were no more than 300 Use synonyms
thousand
UK citizens moving away from the country at the start. The figure Use synonyms
then
went through several ups and downs before it flattened to approximately 360 Linking Words
thousand
leavers in 2002 and 2003. These years were Use synonyms
also
recorded to be the lowest net settlers among the rest of the year. The slope continued to fluctuate before climbing to its climax at more than 400 Linking Words
thousand
emigrants in 2008.Use synonyms