
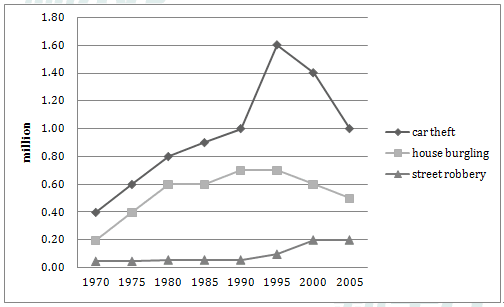
The line chart below displays the number of
cases
of car theft, house burglary and street robbery in the United Kingdom and Wales from 1970 to 2005.
Use synonyms
Overall
, car stealing increased significantly over the entire time period. Linking Words
While
the robbery of houses rose moderately.
At the beginning of the period, there were 0.4 Linking Words
million
Use synonyms
cases
of car theft, Use synonyms
this
grew steadily to 1 Linking Words
million
over the next 10 Use synonyms
years
, before increasing dramatically Use synonyms
in
0.6 Change preposition
to
million
in the next 5 Use synonyms
years
. From 1995 these crime Use synonyms
cases
started to drop sharply, Use synonyms
whereas
in 2005 it went back to 1 Linking Words
million
, maintaining its position as the most committed crime.
In 1970, 0.2 Use synonyms
million
house burgling happened, it doubled in the first five Use synonyms
years
, from 1975 to 1980, Use synonyms
this
steeply peaked, where in 1980 there were around 0.9 Linking Words
million
Use synonyms
cases
, in the same year it started to fall moderately to 0.6 Use synonyms
million
in 1985. From 1985 to 1990, it slightly rocketed to approximately 0.7 Use synonyms
million
, Use synonyms
this
was maintained during the next five Linking Words
years
and during the Use synonyms
last
10 Linking Words
years
it fell modestly, ending the period at just over 0.5 Use synonyms
million
.Use synonyms