
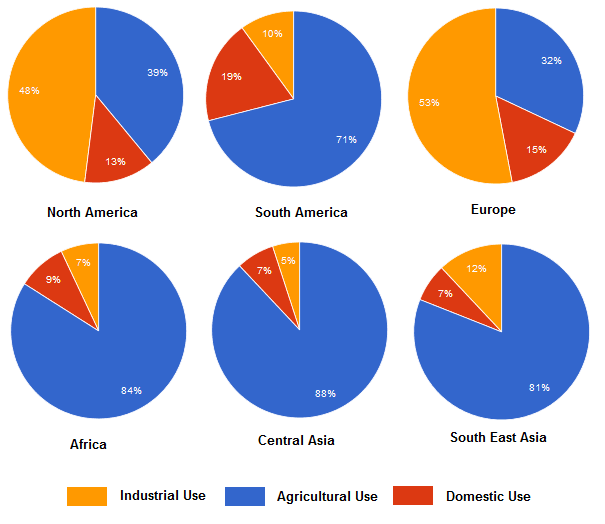
The presented graph depicts data about various
water
consumption purposes in North Use synonyms
America
, South Use synonyms
America
, Use synonyms
Europe
, Africa, Central Use synonyms
Asia
and South East Use synonyms
Asia
.
In general, almost all areas use Use synonyms
water
mainly for agricultural Use synonyms
usage
except in North Use synonyms
America
and Use synonyms
Europe
. On average, agricultural Use synonyms
usage
takes up to 80% of total Use synonyms
water
consumption in Africa, South Use synonyms
America
, Central Use synonyms
Asia
and South East Use synonyms
Asia
. Use synonyms
In contrast
, Linking Words
water
is used mainly for industrial purposes in Use synonyms
Europe
and North Use synonyms
America
, taking up to 50% of total Use synonyms
water
Use synonyms
usage
.
Upon taking a closer examination, it is evident that the least Use synonyms
water
Use synonyms
usage
is coming from the domestic sector with only about 7% to 19% consumption across all continents. The data Use synonyms
also
shows that the percentage of Linking Words
water
used for industrial and domestic sectors in South Use synonyms
America
, Africa, Central Use synonyms
Asia
and South East Use synonyms
Asia
is quite similar with only about a 5% difference Use synonyms
whereas
a significant gap of 40% was observed in North Linking Words
America
and Use synonyms
Europe
.Use synonyms