
The bar reflects the recurrent fast cuisine consumption by the citizens of the United States of America from 2003 to 2013. To commence with,
it is clear that
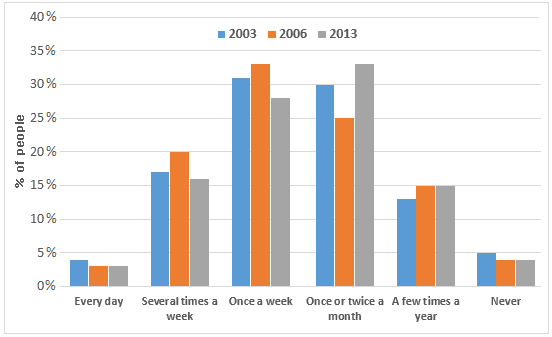
the people of America mainly eat dine-in fast cooks at least once a week or once or twice a month. Meanwhile, those who spend on served foodstuffs every day have the lowest rate set by side to all. As a whole, quickly-served meals mostly taken out at least 1 out of 7 days or more than twice a month, followed by every day and never have been ordered are the rarest.
Linking Words
Furthermore
, from the chart, it can be seen that from 2003 to 2006, junk substances eaten in place at least once a week reached the highest rate, at approximately 32% and nearly 35% respectively. Continued the sum of junk beverage consumption up to twice a month, starting with a percentage of 30% and slightly decreasing to 7% Linking Words
then
rising to almost 3%.
Linking Words
Moreover
, the maximum rate of people visiting the cafeteria for several days in 7 days made it to 20%, happening in 2006, Linking Words
while
in 2003 and 2013 they equally hit lower at the very least 16%. Meanwhile, coming to the bar a few times a year is equally at 15% in 2006 and 2013, each in order. Linking Words
By contrast
, consumers who have never eaten convenience food are more dominant compared to those who have consumed it every day.Linking Words