
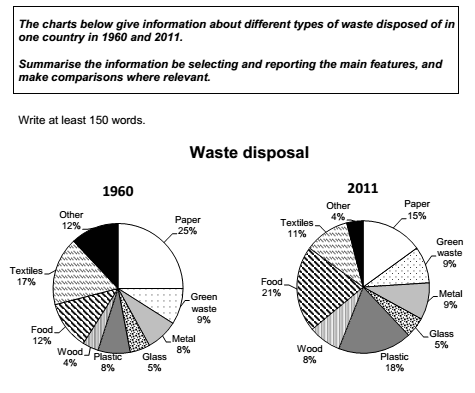
The pie charts compare the proportions of various kinds of garbage thrown out in a particular nation between 1960 and 2011.
Overall
, the Linking Words
percentage
of Use synonyms
paper
Use synonyms
waste
accounted for the largest, Use synonyms
while
wood Linking Words
waste
made up the least part in the beginning. Use synonyms
Whereas
food Linking Words
waste
represented the highest contribution to total Use synonyms
waste
disposal, the smallest contribution was made by others in the final year.
At the beginning of the period, the Use synonyms
paper
held a lion’s share with a quarter of the total disposed of Use synonyms
waste
. The second position in the Use synonyms
percentage
of Use synonyms
waste
was textiles at 17 %. Use synonyms
In addition
, there were no considerable differences in the rate of other, food, plastic and metal rubbish, with their figures ranging from 8% to 12%. The portion of wood and glass disposed Linking Words
waste
made up 8% and 5% respectively.
Regarding the data in the second pie chart, the Use synonyms
percentage
of food Use synonyms
waste
overcame Use synonyms
paper
to rank first in the final year at 21%. The Use synonyms
percentage
of Use synonyms
paper
was 15%, which was a third of that of glass. Use synonyms
In addition
, whilst the rate of wood rubbish was 8%, that of other Linking Words
waste
was minimally lower at 4%. There were no considerable differences in the Use synonyms
percentage
of green and metal Use synonyms
waste
, with their figures starting at 9%. The Use synonyms
percentage
of plastic was the second position in the total disposed of Use synonyms
waste
, with 18% of its proportions Use synonyms
disposing
of in the final year.Wrong verb form
disposed