
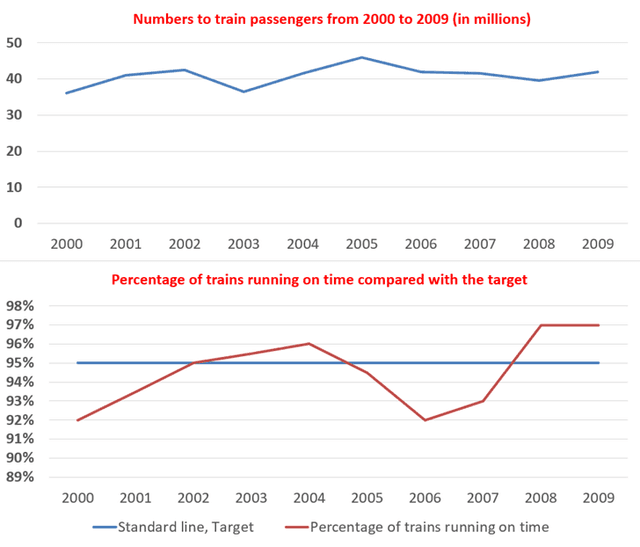
The primary line chart illustrates the aggregate count of train riders between 2000 and 2009,
whereas
the subsequent representation presents the punctuality satisfaction rate. Generally, in spite of a downtrend, the patronage increased as the satisfaction rate surpassed the benchmark at the decade's conclusion.
In 2000, roughly 35 million individuals used the train service. Linking Words
This
tally expanded, yet following a span of two years, a drop set in, reverting the figures to their initial levels by 2003. Linking Words
Nonetheless
, 2005 witnessed a significant rise, elevating the total ridership to 45 million. Subsequent years saw a gentle dip in numbers, with a slight uptick in 2008, culminating in a total of 40 million riders in 2009.
The anticipated train performance level was determined at 95%. In 2000, it fell short by 3%; yet by 2002, it hit the mark, tapering off to 96% by 2004. Linking Words
Conversely
, in the subsequent year, a reduction was noted, bottoming at 92% two years later. Punctuality satisfaction began to draw attention by 2007, shooting up to 97% the following year, and Linking Words
then
stabilizing in 2009.Linking Words