
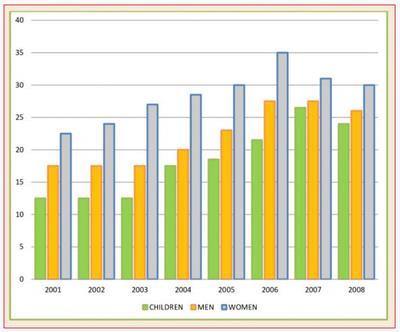
The presented bar chart describes the distribution of British citizens who consumed 5 portions of vegetables and fruits daily from 2001 to 2008.
Overall
, the quantities of all participants remarkably increased; Linking Words
while
the chunk of women witnessed the most dramatic change, that of men and children shared a similar trend.
Looking into details, the proportion of women was dominant at just north of 20% at the start of the course. Linking Words
This
sum rose gradually for the next 5 years and skyrocketed to a high of 35% in the year 2006, preceding a sharp fall to 30% in 2008. Noticeably, the fraction of women maintained its highest status throughout the entire period. Linking Words
In contrast
, children consumed the least amount of vegetables and fruits as the percentage of these participants started at a mere 12%. Linking Words
This
number largely plateaued in the first 3 years, prior to its significant surge in 2004 where it continued to accelerate until reaching a climax of over 25% in 2007 and plummeted to just south of that to end the period. Linking Words
Similarly
, the rate of men was unvaried at around 17% in the initial 3 years. After a remarkable jump in 2004, it peaked at approximately 26% before Linking Words
finally
dropping to just above 25% Linking Words
to conclude
the course.Linking Words