
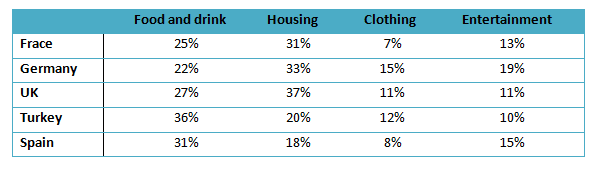
The table compares the portion of household expenditure per month in terms of four categories in five European Nations.
Overall
, it's clear that food and drink Linking Words
as well as
housing expenses were the highest in most countries. Linking Words
However
, the lowest proportion was related to clothing and entertainment in these countries.
The figures witnessed housing was the highest proportion of income at 37% in the UK in comparison with the numbers of clothing payments at 7% in France.The table illustrates the lowest portion belonged to entertainment in most of the countries. The results showed the lowest housing expenses were related to Spain by 18% and Linking Words
Germany
had the most clothing expenditure by 15%.
The result saw food and drink expenditures were the most in Turkey by 36% contrast with Use synonyms
Germany
by 22% .So Use synonyms
Germany
had the lowest food and drink budget. Entertainment income was the highest in Use synonyms
Germany
at 19% in comparison with Turkey at 10%.Use synonyms