
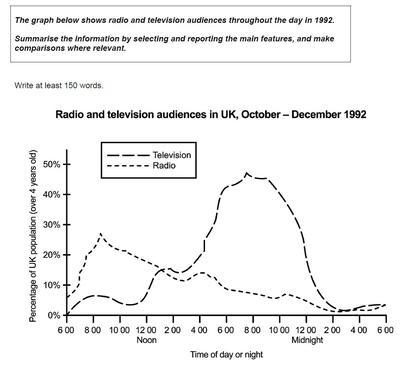
The two line graphs depict how much proportion of the public was entertained by
Radio
and TV programs in twenty-four-hour periods in the UK (the United Kingdom between October and December 1992. Use synonyms
Overall
, the number of audiences varied depending on the time of day Linking Words
as well as
the type of entertainment.
In terms of, the figure for Linking Words
Radio
listeners stayed at the lowest level at 3% from 1:00 to 6:00am, Use synonyms
then
skyrocketed suddenly nearly five-times from the bottom and experienced a peak at 25% at 8:00am. Linking Words
However
, there was a gradual decrease in listening to Linking Words
radio
from Use synonyms
then
on with fluctuations, continuing until the end of day at 24:00 (4%).
As regards to the data given on the second line graph, there were no much changes and a steady number of TV audiences between 3 and 6% until 11:00am from 1:00am. The proportion of viewers considerably increased from Linking Words
then
on, were maximum at just below half at 45% at 21:00 and dramatically plunged to 15% at 24:00.
In sum up, it is obvious that the two different broadcasts witnessed a wide variety of the figure for audiences at various time and Linking Words
also
TV spectators were by far the larger number than the Linking Words
Radio
listeners.Use synonyms