
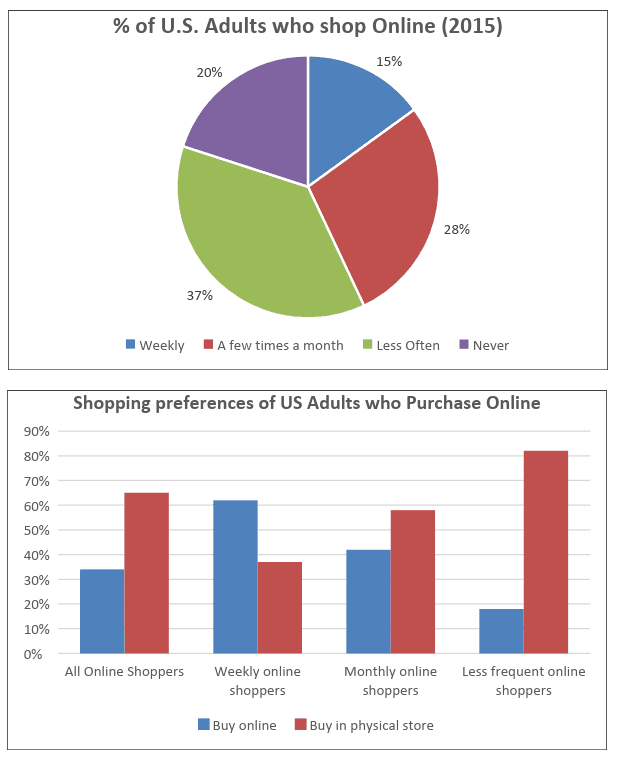
The pie chart gives information about the frequency of American adults’ online shopping
routine
in four categories in 2015, Fix the agreement mistake
routines
while
the bar chart depicts their online shopping preferences. Linking Words
Overall
, less often purchasing showed the highest percentage among people in Linking Words
USA
, Correct article usage
the USA
while
weekly shopping was the lowest. Linking Words
In addition
to the shopping preference, all buyer categories tended to choose Linking Words
offline
stores, except weekly online consumers.
Use synonyms
Firstly
, in Linking Words
USA
, people who did not use online shopping frequently accounted for 37%, followed by a few times a month at 28%. Correct article usage
the USA
Moreover
, the weekly and never categories only made up 35%, which were 15% and 20% respectively, making weekly online purchasing the lowest number of shopping habits.
Linking Words
Secondly
, all online shoppers showed the highest number Linking Words
in purchasing
Change preposition
of purchases
offline
at more than 60%, Use synonyms
while
it was only around 32% for online shopping. Linking Words
Furthermore
, weekly consumers were higher in online, but lower in physical stores, with 60% and 35% in turn. Linking Words
On the contrary
, monthly buyers showed the reverse, with 40% in the online store and 55% in the Linking Words
offline
one. Use synonyms
Lastly
, less frequent online buyers preferred shopping in Linking Words
offline
stores over online.Use synonyms