
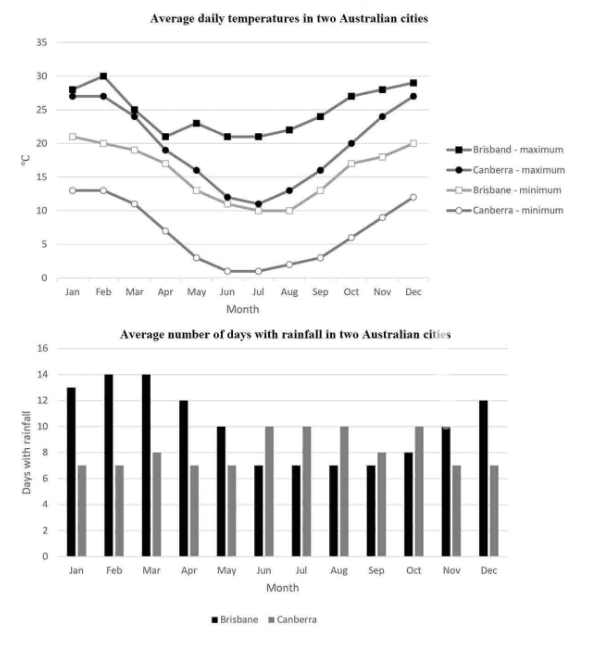
The two provided charts depict the maximum and minimum temperatures per day in measure Celsius and how many
days
happen regularly rainfall in two Australian cities.
Use synonyms
Overall
, Linking Words
it is clear that
there is an upward trend in the percentage of maximum and minimum temperatures per day in two Australian cities from Aug to Linking Words
Dec
Use synonyms
while
there are downward trends of both measures in Jun and July. Linking Words
In addition
, the Linking Words
Brisband
has the highest figure in Feb and Mar, Correct your spelling
Brisbane
while
the opposite is true with the average number of rainy Linking Words
days
in Canberra.
In more Use synonyms
the
Correct article usage
apply
details
, starting at 13 Fix the agreement mistake
detail
days
in Jan, the figures for the average number of Use synonyms
days
with rainfall in Brisband accrue marginally by 1 day in Feb and Mar , followed by a final fluctuation from Apr to Use synonyms
Dec
. Use synonyms
Besides
, similar changes can be seen in the figures for the average number of rainy Linking Words
days
, which stabilize of 7 Use synonyms
days
in Jan, Feb, Apr, May, Nov and Use synonyms
Dec
and experience a notable stability of 10 Use synonyms
days
in 3 months from Jun to Aug.
Looking at the line graph, the percentage of maximum and minimum degrees C in both cities all hit the lowest point in July. Use synonyms
On the contrary
, both measures all reach a peak in Linking Words
Dec
in Use synonyms
Brisband
and Canberra.Correct your spelling
Brisbane