
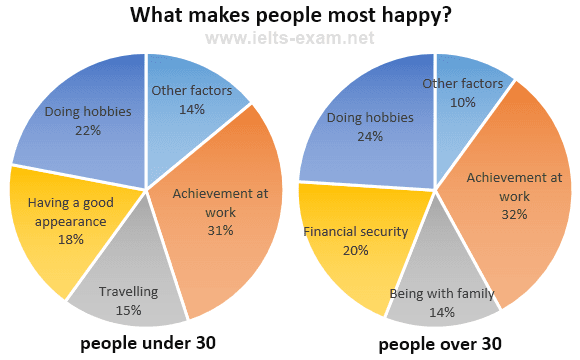
The pie diagram illustrates the distribution of various factors that are mainly responsible for making people more happy in numerous age gaps.
Overall
, success at the workplace and performing their favourite jobs are most prominent Linking Words
while
economic issues, journeys, and many more factors Linking Words
also
help Linking Words
public
to become happy.
Add an article
the public
Firstly
, the proportion of prospects in job sectors is 31% when society Linking Words
are
under 30 Change the verb form
is
however
, the part is 32% when they become over 30. The case of fulfilling hobbies at the same age shows a similar trend Linking Words
whereas
the percentage increases by 2% from low to high age.
Linking Words
On the other hand
, Linking Words
crowd
who are under 30 prefer to travel more around the world, Add an article
the crowd
a crowd
in contrast
, whenever they reach the 30, they try to spend more moments with their family and the proportion is 15% and 14% respectively. Linking Words
In addition
, economic issues are highly significant in making a person happy and the results shown in the chart where that folk over 30 consider more financial security. At the same time, there are other issues which help a person to be happy but these values decreased over time, from 14% to 10%.Linking Words