
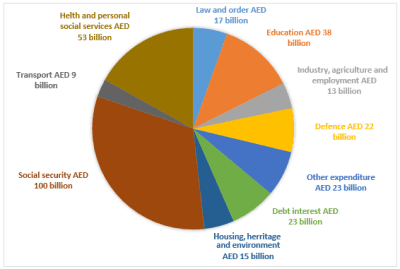
The chart compares the proportion of income that the UAE government spent on ten various divisions in 2000.
the government.
The table shows that in six other
Overall
, it's clear that social security expense was by far the most in these parts Linking Words
while
the chart shows the lowest amount that was spent was related to transport.
the pie chart witnessed Social Security at 100 Linking Words
billion
AED Use synonyms
as well as
health and Personal Social Services at 53 Linking Words
billion
AED were the highest expenditure Use synonyms
however
Transport at 9 Linking Words
billion
AED, Industry,Agriculture and Employment at 13 Use synonyms
billion
AED had the lowest proportionUse synonyms
Change preposition
of
sectors
the UAE government allocated middle budgets.Figures show education had the highest spending 38 Add a comma
sectors,
billion
AED in comparison with five other parts Debt Interest well as Other expenditures 23 Use synonyms
billion
AED and Defence 22 Use synonyms
billion
AED were the next incomes.Numbers illustrate the expenditure related to Law and Order was 17 Use synonyms
billion
AED.Housing,Heritage and Entertainment had 15 Use synonyms
billion
AED payments.Use synonyms