The chart below gives information about how families on one country spent their weekly income 1968 and in 2018

The chart below gives information about how families on one country spent their weekly income 1968 and in 2018
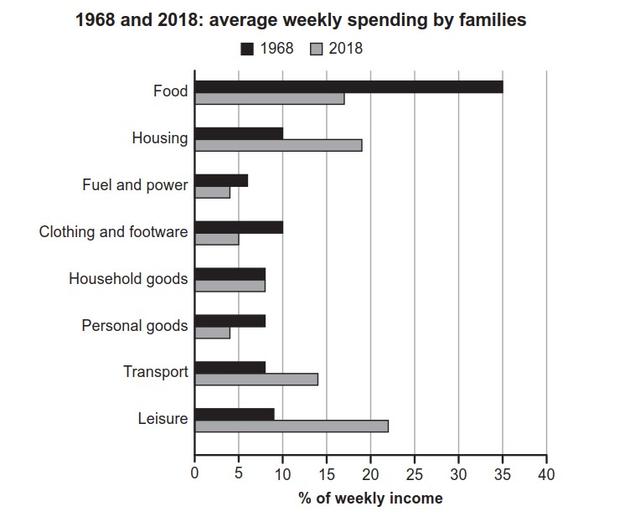
The bar chart depicts the spending of families' weekly revenues in one country compared
in
Change preposition
to
show examples
1960 and
in
Change preposition
apply
show examples
2018.
Overall
,in most cases, people wasted their money on food or leisure in different years among 8 families’ expenses.
However
, outlays for home goods were the same for both years. On the one hand, the biggest expenses of families were on meals in 1968, accounting for 35% of weekly income,
while
costs of eating were approximately 17% in 2018. Compared to 1968, an enormous amount of money was spent on spare-time activities, accounting for about 22% of weekly revenue in 2018,
whereas
outlays for leisure activities were 8% of 7 days income in 2018.
On the other hand
, the remaining costs were on housing, fuel power, clothing and footwear, personal goods, and transport. In 1968, the amount of money on housing, fuel, clothing and footwear,
as well as
on personal goods was more than in 2018,
whereas
the costs of remaining activities were more than in 2018.
Submitted by aibiikenurlanova414 on

Unauthorized use and/or duplication of this material without express and written permission from this site’s author and/or owner is strictly prohibited. Excerpts and links may be used, provided that full and clear credit is given to Writing9 with appropriate and specific direction to the original content.

Linking words: Don't use the same linking words: "whereas".
Basic structure: Change the second paragraph.
Vocabulary: Only 6 basic words for charts were used.
Vocabulary: The word "compared" was used 2 times.
Vocabulary: The word "amount" was used 2 times.
Vocabulary: Use several vocabularies to present the data in the second paragraph.
Topic Vocabulary:
  • Weekly income
  • Expenditure
  • Consumption patterns
  • Cost of living
  • Discretionary spending
  • Inflation
  • Economic indicators
  • Demographics
  • Socio-economic factors
  • Technology advancements
  • Government policies
  • Consumerism
  • Lifestyle changes
  • Fiscal habits
  • Budget allocation
  • Financial priorities
  • Societal trends
  • Purchasing power
  • Income distribution
What to do next:
Look at other essays: