
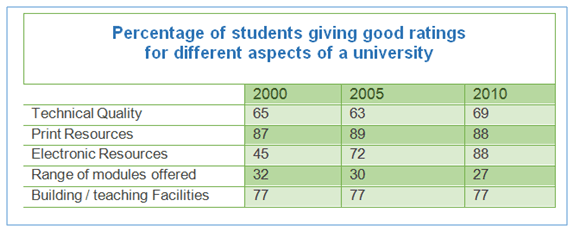
The table illustrates the number of students at a university who gave good ratings in a survey in 2000, 2005, and 2010. The units are measured in percentages.
Overall
, students' evaluations of teaching quality and print resources as good increased from 2000 to 2010, but not as significantly as electronic devices. Linking Words
However
, the rating of the range of modules offered by the university showed a decrease, and building/teaching facilities remained the same from 2000 to 2010.
Print resources received the best rating among different aspects in three of the observed years, except in 2010 when it shared the top spot with electronic resources, both at a maximum figure of 89% in 2005. It began at 84%, increased to 89% in 2005, Linking Words
then
fell by 1 percentage point, reaching 88% in 2010. In terms of teaching quality, it ranged from 63% to 69%. Electronic devices showed the maximum increase among the five different groups, rising from 45% at the beginning of the period to 88% Linking Words
at the end
.
The range of modules offered by the university was the only aspect that showed a decline from 2000 to 2010. Regarding building/teaching facilities, it remained unchanged during the period from 2000 to 2010.Linking Words