
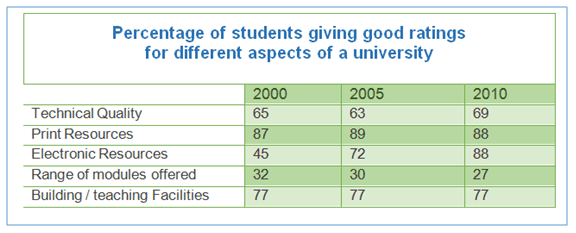
The provided presented in the table depicts the results of surveys conducted in the years 2000, 2005, and 2010, focusing on various aspects of a university as perceived by students.
At a fleeting glance, it is evident that the highest percentage was allocated to print resources throughout the period,
whereas
electronic resources contained the maximum value only in 2010.
Linking Words
According to
the provided information, it can be observed that the print resources had the maximum percentage all over the period, which was 84%, 89%, and 88% respectively. Notably, buildings and teaching facilities remained stable with a rating of 77 per cent throughout the given span.
Turning our attention to the second set of data, the lowest rating was given by university students to the category of range of modules offered, which decreased from 32 per cent in the year 2000 to 27 per cent in 2010. Linking Words
Furthermore
, the rating of teaching quality fluctuated all over the period, it was 65% , 63%, and 69% respectively.Linking Words