The chart shows British Emigration to selected destinations between 2004 and 2007. Write a report for a university lecturer describing the information shown below. Summarize the information by selecting and reporting the main features and make comparisons where relevant.

The chart shows British Emigration to selected destinations between 2004 and 2007.

Write a report for a university lecturer describing the information shown below.

Summarize the information by selecting and reporting the main features and make comparisons where relevant.
The chart shows the number of
British
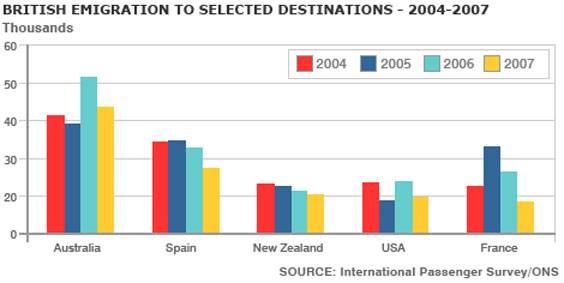
Emigration who were chosen the place to go from 2004 to 2007.
Overall
, Australia registers the largest figure of people selected in all 4 years, meanwhile, New Zealand and the USA record the smallest number for
this
. In 2004, Approximately 41 thousand
of
Change preposition
apply
show examples
British
Emigration who came to Australia,
that
Correct pronoun usage
which
show examples
is the largest figure
in
Change preposition
of
show examples
this
year. Spain is
a the
Choose an article
a
the
show examples
second country in which
British
Correct article usage
the British
show examples
settle
Replace the word
settled
show examples
in
Change preposition
apply
show examples
, at around 35
percent
Change the spelling
per cent
show examples
. New Zealand, USA and France has the same
that
Correct determiner usage
apply
show examples
figure
by
Change preposition
of
show examples
approximately 22
percent
Change the spelling
per cent
show examples
. In 2005, France had
becam
Correct your spelling
become
became
the second favorite place for
British
emigration, at 33 %. In 2006, 55 perc
Submitted by sinh.ielts on

Unauthorized use and/or duplication of this material without express and written permission from this site’s author and/or owner is strictly prohibited. Excerpts and links may be used, provided that full and clear credit is given to Writing9 with appropriate and specific direction to the original content.

Common mistake: Your writing should be 150-250 words.
Vocabulary: Replace the words british with synonyms.
Vocabulary: Rephrase the word "shows" in your introduction.
Vocabulary: Only 6 basic words for charts were used.
Vocabulary: The word "figure" was used 3 times.
Vocabulary: The word "approximately" was used 2 times.
Vocabulary: Use several vocabularies to present the data in the fourth paragraph.
What to do next:
Look at other essays: