
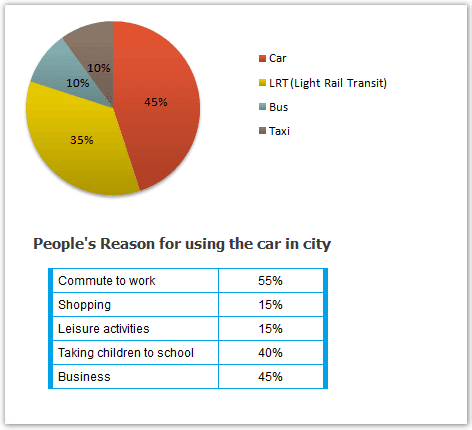
The pie chart illustrates the amount of vehicles used in Edmonton and
following
the present of related reasons for driving by car. From an Wrong verb form
follows
overall
perspective, a higher percentage has belonged to cars than others in order to commute to work.
As observed in the details, nearly half (45%) of Linking Words
people
have carried over by car. After that, about a third (35%) of Edmonton individuals have used light rail transit as transportation. Use synonyms
Moreover
, 10 per cent of Linking Words
people
have preferred to transfer by bus and taxi.
As shown in the table, it stated that why Edmonton Use synonyms
people
have tended to drive in their privet cars Use synonyms
instead
of others. Indeed, more a half the proportion (55%) of Linking Words
this
city has committed to their work by their own automobile. Linking Words
While
45% of Linking Words
people
want to use it merely for business. Use synonyms
Furthermore
, in the case of shopping and doing leisure activities, they preferred to use less (15%) of their own car.Linking Words