
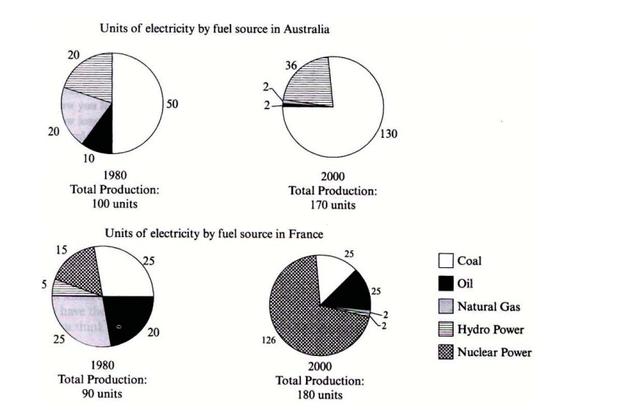
The pie charts display the amounts of electricity measured in units produced via Coal,Natural gas,Nuclear
power
,Oil and Hydropower from 1980 to 2000.Use synonyms
Overall
,it is evident from the chart that the dominant sources of fuel in Linking Words
Australia
and Use synonyms
France
were Coal and nuclear Use synonyms
power
respectively,and the total production increased rapidly over the years.
Use synonyms
To begin
with,In 1980, Coal produced 50% in Linking Words
Austraila
and just Correct your spelling
Australia
a
half of petroleum Correct article usage
apply
generated
in Add a missing verb
was generated
France
. Use synonyms
However
,over the years, the figure for Coal skyrocketed to 130 units in Linking Words
Australia
and that of Use synonyms
France
remained constant till 2000. Use synonyms
Furthermore
,Natural gas and oil were responsible for less than 30% in both countries and it reduced dramatically to Linking Words
a
less than 26% in 2000.
Correct article usage
apply
Furthermore
,Linking Words
hydro
Correct your spelling
hydropower
power
produced a significant value of fuel in Use synonyms
Australia
. Use synonyms
However
, just a small number was manufactured in Linking Words
France
,but there was no production via nuclear Use synonyms
power
in Use synonyms
Australia
and it was the major source in Use synonyms
Use synonyms
france
.Change the capitalization
France
At the end
of the period, the total production of fuel in both countries rose rapidly to the same amounts at 170 units.Linking Words