
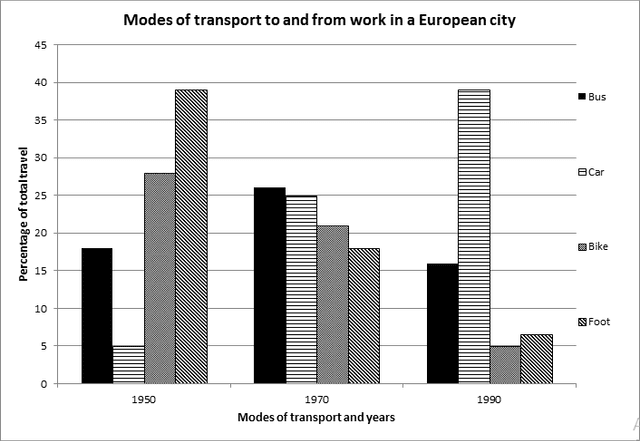
The bar chart compares the types of vehicles that were used for
work
by citizens in Europe between 1950 to 1990.
Use synonyms
Overall
, the people in European countries chose a different kind of transport over the years. At the beginning of the Linking Words
period
, most of the people went to Use synonyms
work
on foot; Use synonyms
however
, the percentage went down over the Linking Words
period
. Use synonyms
Although
the car was the least mode of transportation used in 1950, it became the highest one in 1990.
In the year 1950, almost 40% of the population in a European City used their foot to mobilize from home to Linking Words
work
; Use synonyms
however
, it significantly went down to below 20% in 1970 and about 7% Linking Words
at the end
of the Linking Words
period
. Use synonyms
Furthermore
, Linking Words
although
more than a quarter of citizens used bikes in 1950, only 5% of them used them in the next 20 years and it became the lowest percentage of the figures.
Meanwhile, the number of people who used buses grew from about 17% to around 26% ten years later. Linking Words
However
, it decreased to more than 15% Linking Words
at the end
of the Linking Words
period
. Use synonyms
In contrast
, the rate of Linking Words
travelers
who went to Change the spelling
travellers
work
by car rapidly increased from 5% to 25% in 1970 and reached a peak of 40% in the final year.Use synonyms