
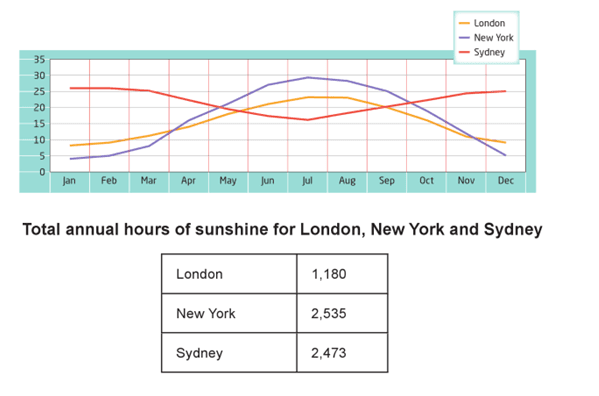
The line graph and the table provide information about the monthly breakdown of temperature
as well as
annual hours of sunshine in three different countries.
Linking Words
Overall
, both countries experienced a different trend of climate throughout the month. Linking Words
Although
, the climate in Sydney was high Linking Words
initially
, Linking Words
however
, it still remained high in the Linking Words
last
month which was higher than in the other nations. Linking Words
Moreover
, the Linking Words
overall
number of hours of sunshine per year in New Linking Words
York
was higher than in the other states Use synonyms
while
London recorded the least.
Linking Words
To begin
with, the condition in Sydney stood at 25, Linking Words
nevertheless
, the figure witnessed a gradual decline to about 16 in July until it reached a peak of 25 in December which was almost the same in January. Both London and New Linking Words
York
did not show much differences in their trend. They recorded about 7 and just below 5 respectively in January, Use synonyms
by contrast
, their figure experienced a significant growth of about 24 and 30. Surprisingly, New Linking Words
York
recorded the highest condition in the middle of the month.
By stark contrast, 2,533 annual hours of sunshine were spent in New Use synonyms
York
. The number was higher the the other country. London recorded 1,180 Use synonyms
while
Sydney had 2,473 which was the second-highest recorded.Linking Words