
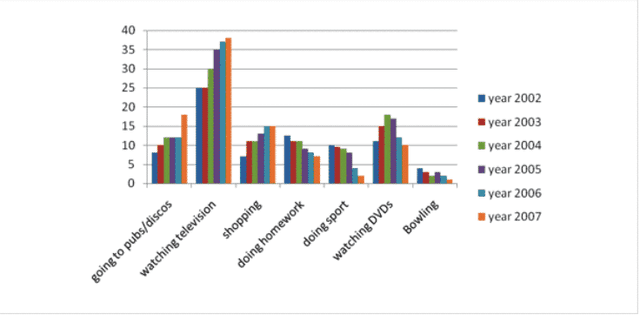
The bar chart, which depicts great detail, provides information about the number of hours that teenagers spend weekly on several activities between 2002 and 2007 in the city of Chester.
Overall
, it can be observed that watching television is the preferred option by the people of Linking Words
this
age group, Linking Words
while
other leisure activities Linking Words
such
as watching DVDs and going shopping increased.
Undoubtedly, the time invested in appreciating films or TV shows registers the highest rates, being 2007 the best year with an allotment of almost 40 hours weekly. Contrarily, bowling is not that popular among teens. Linking Words
As a result
, the best data is only 300 minutes in 2002. Other procedures of amusement are Linking Words
also
highly elected by those maturing, Linking Words
for example
, going to discos.
Linking Words
To sum up
, the favourite choice of the adolescent sector is registered to be watching TV. Contrarily, bowling collects the worst percentages in the course of 5 years in the English city.Linking Words