
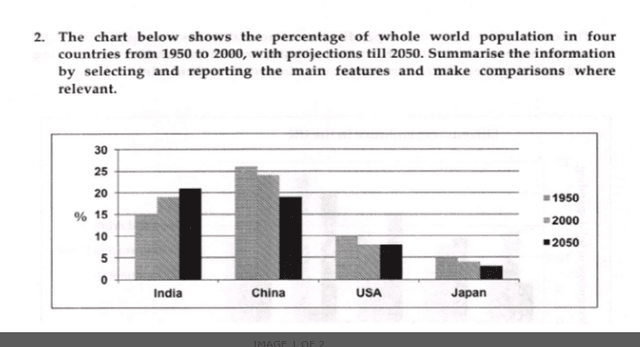
The bar chart represents the total world
population
in 4 Use synonyms
countries
in 1950 and 2002, and some projections for 2050. Use synonyms
Linking Words
Also
the bar diagram represents Add a comma
Also,
Correct article usage
a comparision
comparision
between 4 Correct your spelling
comparison
countries
.
The chart illustrates Use synonyms
Use synonyms
percentage
of the total world Add an article
the percentage
population
Use synonyms
Linking Words
also
represents Correct word choice
and also
Use synonyms
growth
Correct article usage
the growth
rate
of various Use synonyms
countries
. Use synonyms
India
's Use synonyms
growth
Use synonyms
rate
was Use synonyms
constatntly
increasing compared to Correct your spelling
constantly
Use synonyms
china
.In 2050 Capitalize word
China
the
Correct article usage
apply
China
's Use synonyms
population
will be less than the amount of Use synonyms
population
in Use synonyms
India
Use synonyms
on
2002. Change preposition
in
India
eventually increases the Use synonyms
growth
Use synonyms
rate
of Use synonyms
population
and it overtakes the Use synonyms
growth
Use synonyms
rate
of Use synonyms
the
Correct article usage
apply
China
. The Use synonyms
percentage
of Use synonyms
India
's Use synonyms
population
in 2050 will be more than the Use synonyms
china
's Use synonyms
percentage
. Use synonyms
China
's Use synonyms
percentage
Use synonyms
on
1950 will remain highest Change preposition
in
Untill
Correct your spelling
until
India
overtakes it.
When we compare the Use synonyms
percentage
of the Use synonyms
population
of Use synonyms
USA
and Correct article usage
the USA
Japan
, Use synonyms
Japan
remains less and Use synonyms
USA
has the highest .The Correct article usage
the USA
percentage
of Use synonyms
USA
in 1950 Correct article usage
the USA
is
more than the Wrong verb form
was
population
in Use synonyms
Use synonyms
japan
in 1950. Capitalize word
Japan
Japan
has Use synonyms
lowest
Correct article usage
the lowest
percentage
Use synonyms
rate
of all.
The Use synonyms
comparision
betweenCorrect your spelling
comparison
4
Correct article usage
the 4
countries
Use synonyms
werte
illustrated in the bar chart . I concluded and Correct your spelling
were
summariesd
the features and Correct your spelling
summarised
summarized
comoparision
between Correct your spelling
comparison
comparisons
countries
that are Use synonyms
relevent
.Correct your spelling
relevant