
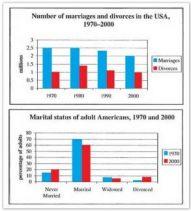
The bar graphs display the cases of marriage and
divorce
from 1970 to 2000 and the marital status of individuals in the same period of time in the United States.
Use synonyms
Overall
, marriage decreased during the Linking Words
years
, Use synonyms
while
Linking Words
divorce
fluctuated. The significant feature of the Use synonyms
secod
graph is that married people had a many times greater percentage than any other status in both Correct your spelling
second
years
.
In 1970, 2.5 Use synonyms
million
Use synonyms
of
individuals were married and Change preposition
apply
this
was maintained in 1980, but in the next 10 Linking Words
years
, it dropped moderately by 0.1 Use synonyms
million
, Use synonyms
while
in 2000 it Linking Words
decline
dramatically to 2 Wrong verb form
declined
million
. There were 1 Use synonyms
million
cases of Use synonyms
divorce
in 1970, and Use synonyms
this
rose sharply in the next 10 Linking Words
years
, to 1.4 Use synonyms
million
, Use synonyms
then
it went down to 1.1 Linking Words
million
in 1990 and in 2000 it fell back to 1 Use synonyms
million
.
Married people had the highest proportion compared to the other Use synonyms
status
in both Correct your spelling
states
years
, in 1970, it had a percentage of 70%, Use synonyms
while
in 2000 it dropped by 10%, to 60%. Followed by those who were never married, with 15% and 20% in 1970 and 2000 respectively. Linking Words
Widows
people had a similar percentage in both Change the noun form
Widow
years
, in 1970, it was 9% and in the next 30 Use synonyms
Use synonyms
years
it decreased by 1%. Add a comma
years,
Finally
, there were very few cases of Linking Words
divorce
in 1970, with only 2%, Use synonyms
this
grew significantly to 10% in 2000.Linking Words