
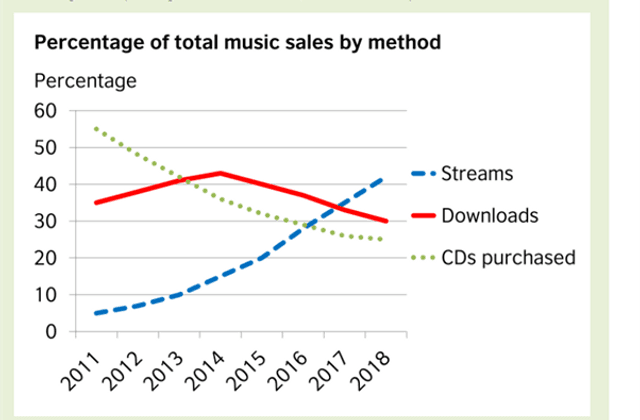
The line graph illustrates the rate of total
music
selling by three forms of Use synonyms
music
buying approaches, namely streams, Use synonyms
downloads
, and Use synonyms
CDs
purchased from 2011 to 2017. Use synonyms
Overall
, the Linking Words
music
sales percentage with Use synonyms
downloads
and Use synonyms
CDs
declined throughout the period, Use synonyms
whereas
stream method rates saw significant growth.
In 2011, CD buying, which was the most popular way of Linking Words
music
marketing, accounted for approximately 55%, 20%, and eleven times more than Use synonyms
downloads
and stream methods. Since Use synonyms
then
, the figure for Linking Words
CDs
purchased has reduced steadily to a bottom of roughly 25% in the Use synonyms
last
year, which was less than others. Linking Words
Likewise
, Linking Words
music
listing by Use synonyms
downloads
ways, after rising to just above 40% in 2014, experienced a moderate fall to 30% in 2018.
Use synonyms
In contrast
, the number of streams, less than others in the first year, climbed considerably and reached a peak of 40% in the Linking Words
last
years, nearly 10 and 15 per cent higher than Linking Words
downloads
and Use synonyms
CDs
.Use synonyms