
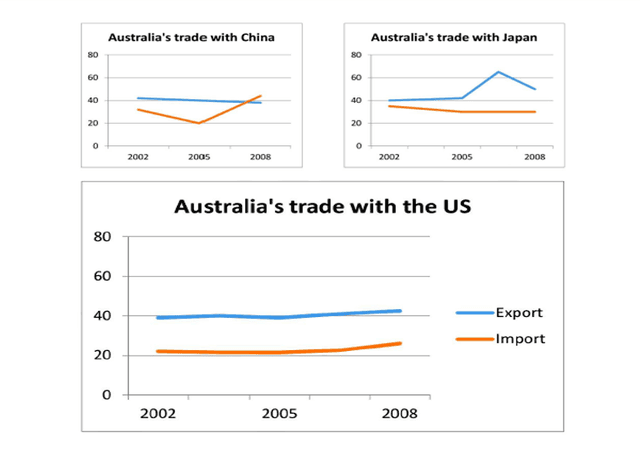
The following charts illustrate the value of Australia's trade with China, Japan and the United States between 2004 to 2009. Units are measured in Australian
dollars
.
Use synonyms
Overall
, it is readily apparent that 2008 was the year with the highest peak of both exports and imports in the three countries analyzed.
Linking Words
For instance
, when talking about exports, Japan is the Linking Words
leader
country amongst the others with a value of 40 billion Australian Replace the word
leading
dollars
in 2008. It is closely followed by China, with an export rate reaching more than 30 billion Use synonyms
dollars
in 2009. Use synonyms
Finally
, the United States sits in third place with less than 10 billion Linking Words
dollars
for every year recorded in the study.
Use synonyms
Furtheremore
, we can notice that imports experienced fewer changes than exports, with a Correct your spelling
Furthermore
steadily
trend of almost 20 Change the adverb
steady
billions
for Japan from 2004 to 2009, which was almost the same Change to singular
billion
to
the United States with just above 20 Change preposition
for
billions
in the Change to singular
billion
spand
of 6 years. Correct your spelling
span
This
differs from Australia's trade with China, in which the rate kept climbing from the starting year to reach a peak in 2008 and Linking Words
drop
suddenly in 2009.Wrong verb form
dropped