The chart below gives information about how families in one country spent their weekly income in 1968 and 2018. Summarize the information by selecting and reporting the main features, make comparisons where relevant.

The chart below  gives information about how families in one country spent their weekly income in 1968 and 2018.

Summarize the information by selecting and reporting the main features, make comparisons where relevant.
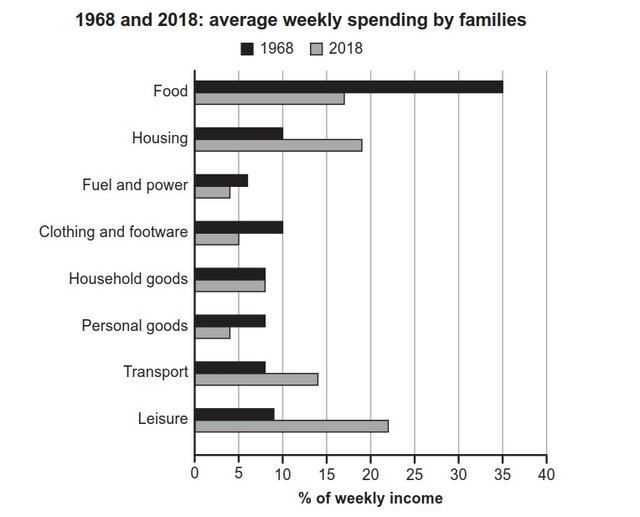
The bar chart illustrates how households in a state distributed their earnings for the week in the years 1968 and 2018.
Overall
, it can be seen that the biggest expense in 1968 was food,
while
in 2018 most of the money was spent on leisure.
In addition
, in 1968 families spent most of their money on their diet and left less for other areas,
while
in 2018 there was some balance between expenditures. In 1968 people spent exactly 35% of their weekly funds
for
Change preposition
on
show examples
nutrition,
in contrast
with 2018 when those percentages dropped to around 17%.
On the other hand
, in the latter year, the free time of the families took most of their money for the week with above 20% of them. Nourishment was the main expenditure for households in 1968,
while
people spent no more than 10% of their profit for every other component from the areas left. In 2018 more balanced budget was observed with the main part spent on leisure, followed by housing, food and transport with sums between 15% and 20% of their weekly profit.
Submitted by delulcheva on

Unauthorized use and/or duplication of this material without express and written permission from this site’s author and/or owner is strictly prohibited. Excerpts and links may be used, provided that full and clear credit is given to Writing9 with appropriate and specific direction to the original content.

Linking words: Don't use the same linking words: "while".
Basic structure: Change the fourth paragraph.
Vocabulary: Only 4 basic words for charts were used.
Vocabulary: Use several vocabularies to present the data in the second paragraph.
Vocabulary: Use several vocabularies to present the data in the fourth paragraph.
Topic Vocabulary:
  • expenditure patterns
  • proportion
  • weekly income
  • accounted for
  • total expenditure
  • housing and utility expenses
  • transportation costs
  • other expenses
  • education
  • healthcare
  • leisure activities
  • spending patterns
  • witnessed a considerable rise
  • experienced a substantial increase
  • allocating a larger proportion
  • reducing their expenditure
What to do next:
Look at other essays: