
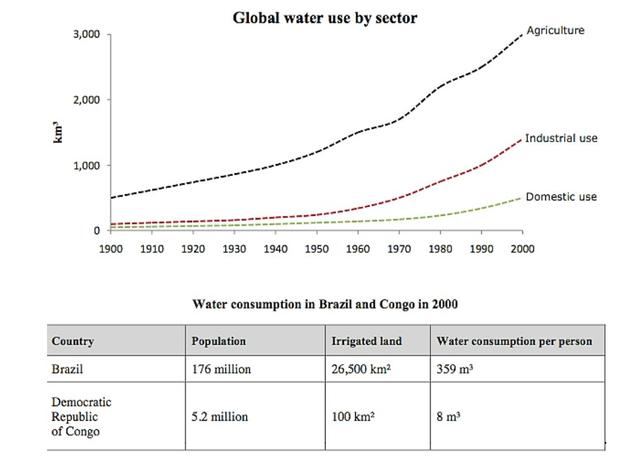
The line chart illustrates the
amount
of Use synonyms
water
used in three sectors in the world namely agriculture, manufacturing and home between 1900 and 2000. The table demonstrates how much Use synonyms
water
consumed in Use synonyms
Brazil
and the Democratic Republic of Use synonyms
Congo
in 2000.
Use synonyms
Overall
, there was a significant increase in the Linking Words
amount
of Use synonyms
water
used in all sectors, with the largest figure seen in agriculture throughout the period. Use synonyms
In addition
, Brazilians consumed Linking Words
water
far higher than in Use synonyms
Congo
.
The Use synonyms
amount
of Use synonyms
water
intended for Agriculture started at 500 km3 in 1900, before dramatically rising and reaching the peak at 3000 km3 in 2000. Use synonyms
Similarly
, Linking Words
water
use in industrial and domestic witnessed strong growth from 200 km3 to 1500 km3 and from 100 km3 to about 300 km3 respectively.
Use synonyms
Brazil
’s population is larger than Use synonyms
Congo
’s, which led to the Use synonyms
water
consumption can Use synonyms
also
be seen as a big difference. 176 million people resided in Linking Words
Brazil
in 2000; meanwhile, the figure for Use synonyms
Congo
was 5.2 million people. Use synonyms
Brazil
allocated 25,500 km2 of Use synonyms
water
for irrigated land, compared to 100 km2 in Use synonyms
this
sector’s Linking Words
Congo
. It can be seen as a resemble trend, the Use synonyms
amount
of Use synonyms
water
consumption per person in Use synonyms
Brazil
was 359 m3, Use synonyms
while
in Linking Words
Congo
was 8 m3.Use synonyms