
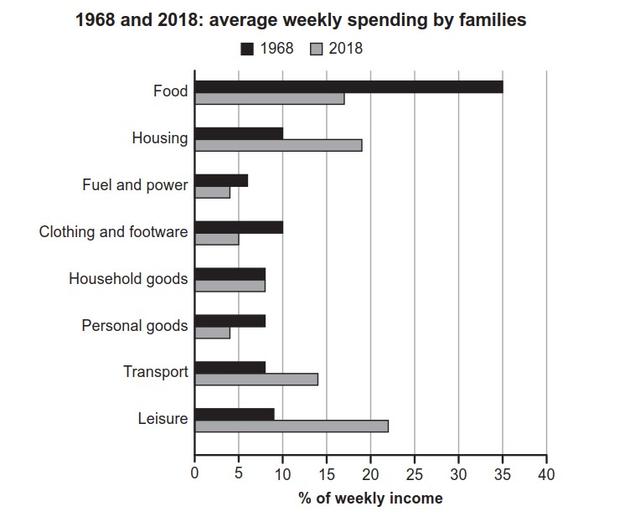
The bar chart illustrates certain families’ consumerism for a period of one week in 1968 and 2018.
Overall
, it can be seen that there was a different priority on which the Linking Words
money
had to be spent. Use synonyms
Furthermore
, a fluctuation in the proportion of families’ weekly spending can be seen over the time given.
In 1968, food had become the top priority to be bought each week, spending over one-third of one family’s income. The latter needs to be bought were housing stuff, and clothing and footwear, which each used 10% of their income. Followed by leisure, transport, personal and household Linking Words
goods
, which held 9%, and 8% each for the three components respectively. The least prioritized was fuel and power which only took 6% of the total earnings.
Contrary to 1968, the first commodity that took up the earnings in 2018 was leisure, which was 23%, followed by housing and food by slightly 4% and 6% respectively. Despite being not prioritized in 1968, the Use synonyms
money
spent on transport rose to 14% Use synonyms
this
year. Even though the need to spend Linking Words
money
on clothing and footwear was declining by 5% Use synonyms
this
year, the Linking Words
money
spent on household Use synonyms
goods
stayed the same. The lowest consumption went to personal Use synonyms
goods
and fuel and power, making fuel and power the least prioritized Use synonyms
goods
to buy in both years.Use synonyms