
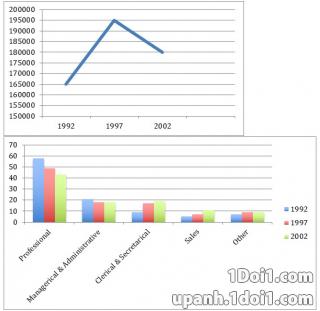
The line chart illustrates how many students graduated in the UK between 1992 and 2002,
whereas
the bar graph provides data about the levels of their jobs in the same period.
Linking Words
Overall
, the number of people obtaining a diploma witnessed a considerable increase after a decade. Linking Words
In addition
, the proportion of employees working as professionals had consistently the highest figures throughout the stage examined.
165.000 students earned a degree in 1992, followed by a significant growth to 195.000 students in 1997. Linking Words
Then
, the total of degrees awarded by UK schools saw a sharp decline to around 180.000 Linking Words
at the end
of the interval.
Despite some fluctuations, a professional was still the most popular title over 10 years, with respective numbers being approximately 60%, 50% and 40%. Linking Words
Conversely
, only 10% of employees worked as clerical and secretarial in 1992, but it Linking Words
then
doubled to 20% in the next 5 years and stayed the same in the final year. Linking Words
Similarly
, no one opted for sales in 1992 before experiencing a dramatic rise to 5% in 1997 and continuously climbing to 10% in 2002. The percentage of managerial positions and other statuses had no significant changes throughout the period, all of them were stable at 20% and 10% in that order.Linking Words