
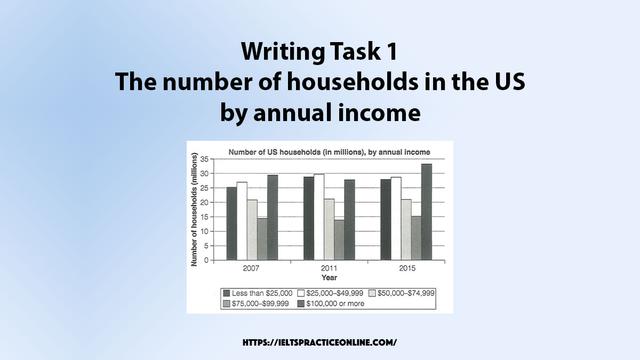
The provided bar
chard
depicts the information about the Correct your spelling
chart
number
of Use synonyms
households
categorised by their yearly Use synonyms
income
in the US in the Use synonyms
year
2007, 2011 and 2015.
Fix the agreement mistake
years
overall
, it can be seen that there was an upward trend in the Linking Words
number
of Use synonyms
households
Use synonyms
according to
their Linking Words
income
in 2007 and 2015 except Use synonyms
2011
. Change preposition
in 2011
However
, the highest and the second lowest yearly Linking Words
income
ranges Use synonyms
containing
more Wrong verb form
contain
Use synonyms
number of
Correct quantifier usage
apply
households
than the others.
Use synonyms
To begin
with, the yearly earning Linking Words
categori
of more than $100,000 contained around 30 Correct your spelling
category
million
Use synonyms
households
in 2007, which increased in 2015 Use synonyms
approximately
33 Change preposition
to approximately
million
Use synonyms
households
Use synonyms
except
a slight decrease in 2011 of around 27 Add the preposition
except for
million
families. Use synonyms
Moreover
, the two annual Linking Words
income
sections between less than $25,000 to $49,999 Use synonyms
were
consisted Unnecessary verb
apply
around
25 to 27 Change preposition
of around
million
Use synonyms
familes
in 2007 and 2011 these Correct your spelling
families
number
Use synonyms
raised
to around 29 to 30 Verb problem
rose
million
Use synonyms
households
Use synonyms
whereas
the Linking Words
number
of Use synonyms
households
Use synonyms
falling
back to around 27 to 29 Wrong verb form
fell
million
in the year 2015.
The Use synonyms
income
range of $50,000-$74,000 and $75,000- $99,999 remained similar by containing around 21 Use synonyms
million
Use synonyms
households
and approximately 15 Use synonyms
million
Use synonyms
households
in 2007, 2011 and 2015 respectively.Use synonyms