
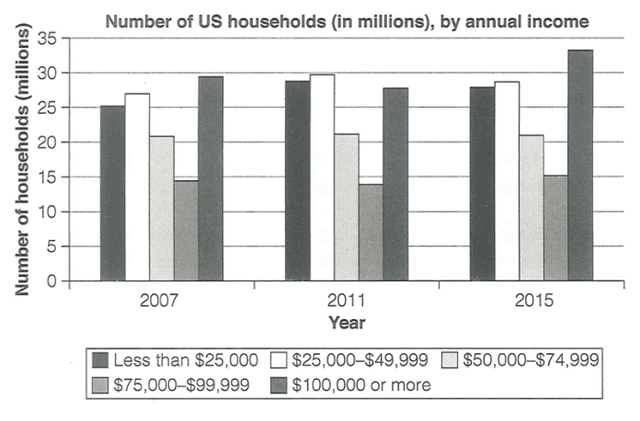
The graph compares the number of accommodations in the US by their yearly income in 2007, 2011 and 2015.
Overall
, the number of households that had income less than 50,000 Linking Words
dollars
and 75,000 Use synonyms
dollars
or more, fluctuated over the years. Use synonyms
However
, the same annual earnings range from 50,000 Linking Words
dollars
to 74,999 Use synonyms
dollars
remained constant from 2007 to 2015.
Use synonyms
Firstly
, the number of households with income less than 25,000 Linking Words
dollars
and between 25,000 and 49,999 was 25 Use synonyms
million
and nearly 27 Use synonyms
million
in 2007, respectively. These figures rose to almost 29 Use synonyms
million
and almost 30 Use synonyms
million
, respectively in 2011, but dropped to approximately 28 and 29 Use synonyms
million
in the following period.
Use synonyms
On the other hand
, the households who had earned not less than 50,000 Linking Words
dollars
and not more than 74,999 Use synonyms
dollars
didn't change in these periods. Use synonyms
However
, the same with earning 75,000 to 99,000 Linking Words
dollars
Use synonyms
as well as
100,000 Linking Words
dollars
or more, witnessed slight fluctuations. The first group fell from nearly 14 to nearly 13 in 2011 and climbed to exactly 15 in 2011. Use synonyms
Similarly
, the latter group followed the same trend, which was nearly 30 in the first period, dropped to nearly 27 and Linking Words
then
culminated at approximately 33 in the Linking Words
last
year.Linking Words