
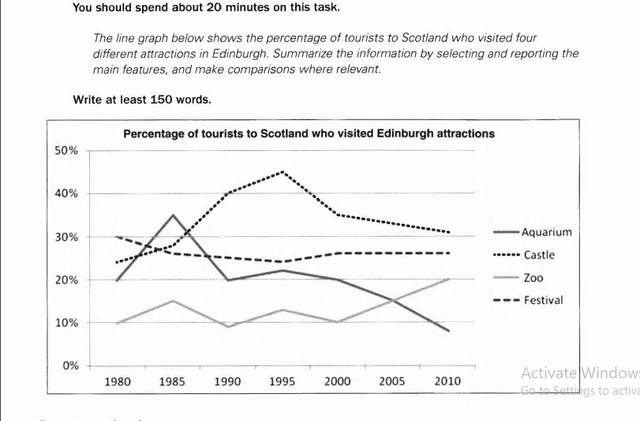
The diagram above illustrates the proportion of travellers to Scotland who came across 4 different attractions from 1980 to 2010.
Overall
, Linking Words
while
there was an upward trend in the number of tourists visiting the zoo, and castle the opposite was seen in aquariums and festivals.
Accounting for 23%, the percentage of tourists visiting the castle was 7% less than the highest, festivals, and twice as much as the safari. Linking Words
This
figure experienced a substantial increase and Linking Words
then
peaked at 44% in 1995. Despite the drop to 32% since 1995, the castle was still the most visited place. The national parks exhibited fluctuations over two decades before increasing to 20% Linking Words
at the end
of the observed period/ the conclusion of the study period.
Linking Words
Conversely
, the number of festivals was the highest, with 30%, 10% higher than aquatic museums. A gradual descent was seen in the number of visitors who visited the feast. Linking Words
Similarly
, aquariums experienced a significant decline after peaking at 36% in 1990 and became the place which attracted the least tourists.Linking Words