
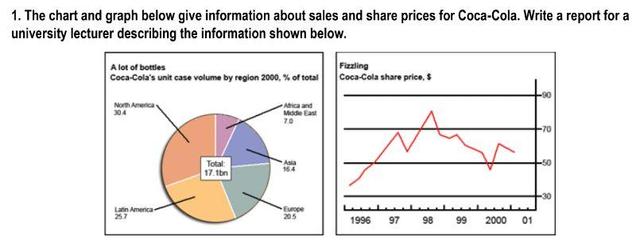
The pie chart and graph illustrated the
percent
of sales and share amount for Coca-Cola, respectively, in 2000 and the years between 1996 and 2001.
In the pie chart, describe the proportion of Coca-Cola sales in 2000. Change the spelling
per cent
The north
Correct article usage
North
Ameris
is the highest of trading with Correct your spelling
America
the
Correct article usage
a
percetages
of 30.4%, Correct your spelling
percentage
percentages
while
Linking Words
africa
and Change the capitalization
Africa
Add an article
the middle
middle east
Correct your spelling
Middle East
was
Correct subject-verb agreement
were
lower
Replace the word
lowest
used
only 7%. The second largest is Latin America, accounting for a quarter. Afterwards, Europe and Asia were the minimum, at about 20.5% and 16.4%, respectively. Wrong verb form
using
Overall
, the total Linking Words
of
volume at around 17 Change preposition
apply
lbn
.
The graph demonstrated a fluctuation trend in share price during a period of five years. There was Correct your spelling
lbs
lb
Correct article usage
a siginificant
siginificant
rise in 1996. Correct your spelling
significant
Then
, the figure dipped sharply in 1998. The peak of Linking Words
share
price Correct article usage
the share
approximately
80%. It is predicted that the figure will decline and reach 48% in 2000. After Add a missing verb
is approximately
decresing
Correct your spelling
decreasing
steady
in 2000, the rate of Change the word
steadily
Coca-cola
sales Correct your spelling
Coca-Cola
grow
in the following year.Wrong verb form
grew