
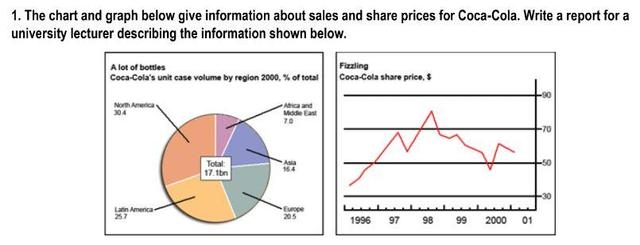
The pie chart and line graph depict the
volume
of Use synonyms
Coca-cola
sold around the world and the Correct your spelling
Coca-Cola
stock
prices, respectively. It is clear from the pie chart that North Use synonyms
America
has the Use synonyms
most
percentage sold, and the Correct word choice
highest
stock
prices are fluctuating as the years pass.
Use synonyms
According to
what is shown, the total Linking Words
volume
of Use synonyms
Coca-cola
that was produced around the world is 17.1 billion Correct your spelling
Coca-Cola
unit
Fix the agreement mistake
units
volume
. Use synonyms
In addition
, Linking Words
this
Linking Words
volume
is distributed as the following, North Use synonyms
America
with the highest percentage with 30.4%, Latin Use synonyms
America
with 25.7, Europe with 20.5, Asia with 16.4, and Use synonyms
finally
, Africa and the Middle East with the lowest percentage. The Linking Words
stock
price started in 1996 Use synonyms
with
only about 32 Change preposition
at
dollars
per share, and since Use synonyms
then
it showed a sharp increase Linking Words
untill
it reached its peak in 1998 Correct your spelling
until
with
about 80 Change preposition
at
dollars
per Use synonyms
stock
, unfortunately, the Use synonyms
stock
experienced a dramatic decrease in Use synonyms
it
priceChange the pronoun
its
,
until it reached its final price with only about 60 Remove the comma
apply
dollars
per share in 2000.
Use synonyms
To sum up
, we could say that the Linking Words
stock
prices reached Use synonyms
its
peak in 1998 Correct pronoun usage
their
with
80 Change preposition
at
dollars
per share and the highest consumers of Use synonyms
Coca-cola
are in North Correct your spelling
Coca-Cola
America
.Use synonyms