
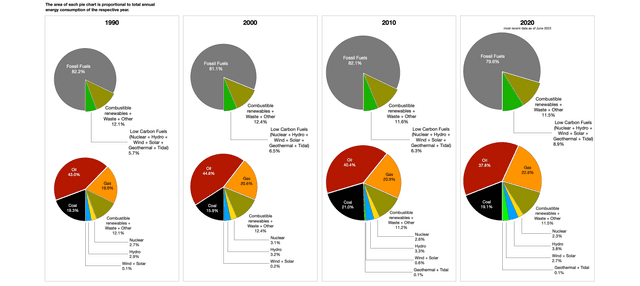
The two pie charts provide information about the
overall
global Linking Words
energy
utilization and Use synonyms
energy
production in the previous year.
Use synonyms
Overall
, the majority of consumed Linking Words
energy
Use synonyms
last
year came from Linking Words
oil
. Among the seven source categories, the coal industry provided the largest electrical power supply worldwide.
It is noticeable that more than a quarter of Use synonyms
power
used worldwide was produced by crude Add an article
the power
oil
at 34%. Use synonyms
While
coal and gas accounted for almost identical figures of 25.1% and 20.9% respectively, combustible renewables and waste were just 10.6% of the total consumed Linking Words
energy
.
Looking closely at the figures for Use synonyms
electricity
generation, clearly, coal accounted for the highest proportion of generated Use synonyms
electricity
at 39.8%. Use synonyms
This
is followed by natural gas which created 19.6% of total world Linking Words
electricity
produced. The percentage of power supply generation using Use synonyms
oil
was not proportional to its consumption, as few as 6.7% was generated using Use synonyms
oil
reserves. Water and nuclear sources were Use synonyms
also
considerably greater in terms of generation compared to consumption 16.1% and 15.7%. Linking Words
Furthermore
, there are other resources for both supply and use but it was just a marginal figure. Linking Words
Finally
, there was no Linking Words
electricity
that was produced Use synonyms
last
year using renewable combustions and wastes.Linking Words