
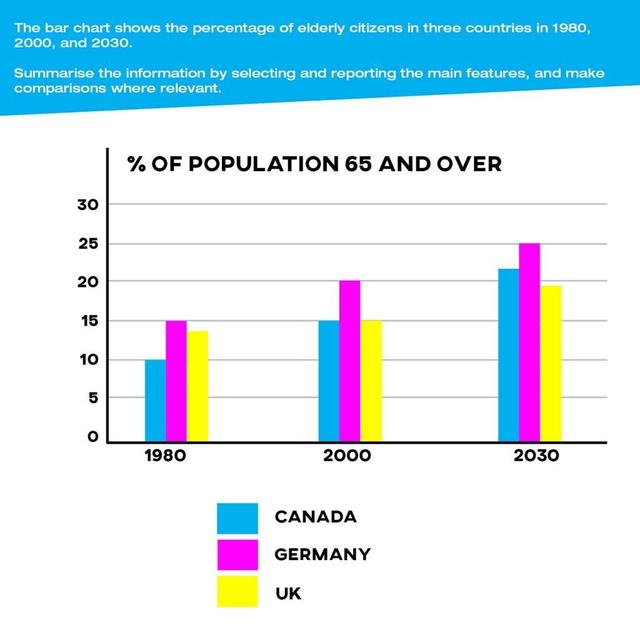
The chart below illustrates the proportion of elderly citizens in
Canada
, Use synonyms
Germany
and the Use synonyms
UK
in 1980, 2000 and 2030.
Use synonyms
Overall
, there are differences between these three countries over the years.
According Linking Words
from
the bar chart, the percentage of elderly in Change preposition
to
Germany
has the highest proportion and will increase by 5 per Use synonyms
cent
between 2000 and 2030. Use synonyms
Whereas
, the percentage of elderly in Linking Words
Canada
in 1980 was the lowest at 10 per Use synonyms
cent
and the Use synonyms
UK
was almost as high as Use synonyms
Germany
. In 2000, both Use synonyms
Canada
and the Use synonyms
UK
had the same proportion of old citizens and less than Use synonyms
Germany
by 5 per Use synonyms
cent
. In 2030, the percentage of elderly in Use synonyms
Canada
will surpass the Use synonyms
UK
by a little more than 20 per Use synonyms
cent
and the Use synonyms
UK
will almost reach 20 per Use synonyms
cent
.Use synonyms