
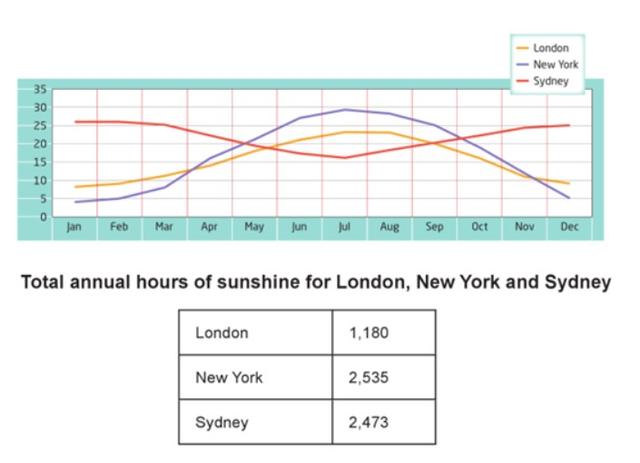
The graph indicates the
overall
Linking Words
temperature
of each month during the year in three different regions, namely Use synonyms
London
, New Use synonyms
York
and Use synonyms
Sydney
; Use synonyms
Also
, the sum of the sunshine hours in the mentioned areas within the period is demonstrated in the table.
In general, Linking Words
it is clear that
the Linking Words
temperature
pattern in Use synonyms
London
and New Use synonyms
York
is completely Use synonyms
in contrast
with Sydeny’s. Linking Words
Moreover
, Londen has the least total sunshine time in Linking Words
this
group.
In terms of average Linking Words
temperature
, what stands out from the scheme is that Use synonyms
London
and New Use synonyms
York
approximately follow the same path in the matter of average air Use synonyms
temperature
. Use synonyms
Conversely
, Linking Words
Sydney
is in a diverse position; in more detail, it is around 10 and 15 degrees hotter in comparison with Use synonyms
London
and New Use synonyms
York
respectively in the first and Use synonyms
last
months of the year. Linking Words
However
, in the middle of the year, New Linking Words
York
and Use synonyms
Sydney
are the hottest and coolest cities individually.
Regarding the table, it can be seen that New Use synonyms
York
and Use synonyms
Sydney
are highly close to each other in terms of the whole of sunshine hours during the period. Use synonyms
on the other hand
, Linking Words
London
with almost half of their hours is in the third rank.Use synonyms