
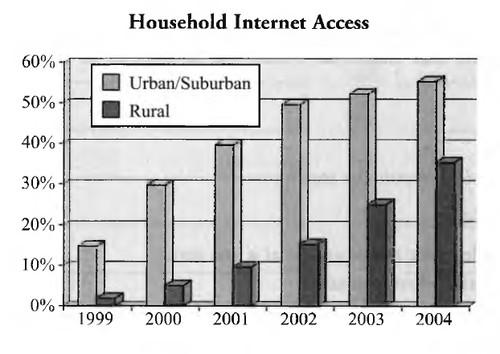
The provided graph illustrates the percentage of people who had a network (city and village) connection in European countries during the period of 1999 to 2004.
Overall
,the majority of the population who had internet access were more Urban than Rural in the given duration of time. Linking Words
However
, both households' network facilities significantly increased throughout the years.
In terms of cities or nearby areas had internet facility very much higher than other places. In 1999 it could only be accessed by just over 10% of the community but Linking Words
at the end
of the year, it reached five times higher at just over 50%. Linking Words
Also
, when compared to other areas urban access rate was four times larger than throughout the period except 2004 but still it was comparatively high.
Linking Words
Although
, in 1999 rural areas internet access was hitting the bottom at roughly 2% it steadily climbed to around 35% Linking Words
at the end
of the period. In comparison, in rural places, the highest number of people who had Linking Words
connection
was only about 30% but it was still much lower than city folk.Fix the agreement mistake
connections