
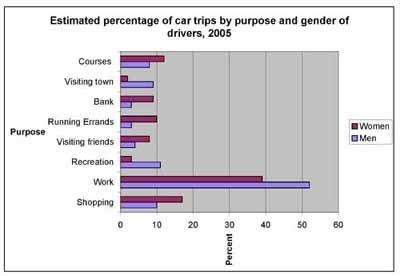
The given bar chart illustrates the proportion of vehicle travel based on purpose and gender of drivers in one period (2015).
Overall
, it is vividly seen that work was the most popular for both genders in using Linking Words
cars
, followed by shopping and courses, Use synonyms
while
going to the bank was the least to visit using Linking Words
cars
in the year.
Looking into details, women and Use synonyms
men
tended to use Use synonyms
cars
for work. In Use synonyms
this
case, the rate of Linking Words
men
utilising Use synonyms
cars
was much higher than that of women, with over a half and just under a half respectively. in terms of shopping activity, Use synonyms
this
figure shows that women used Linking Words
cars
more than Use synonyms
men
, with almost double for Use synonyms
men
, with (18%). It was the second position compared to other activities for both genders. Use synonyms
Also
, approximately a fifth of the courses that Linking Words
men
went to in 2015, Use synonyms
while
just 8 % of males used their Linking Words
cars
for Use synonyms
this
duty. Linking Words
In contrast
, the lowest rate of using Linking Words
cars
was for visiting banks, with under 10% of males and only 3% of females in 2015.Use synonyms