
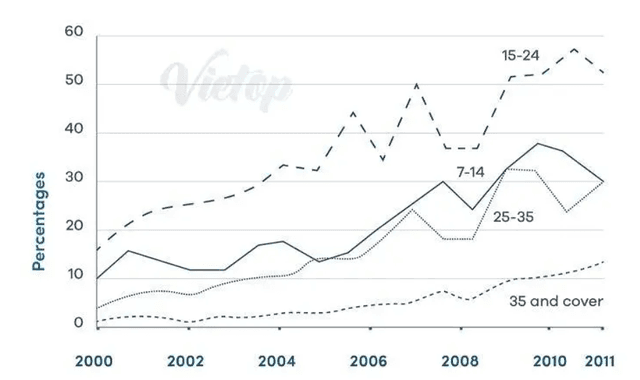
The given line chart shows the trend of different age groups of people
Correct pronoun usage
who attended
attended
Correct pronoun usage
who attended
Change preposition
apply
at
Change preposition
apply
Use synonyms
Fix the agreement mistake
cinemas
cinema
in the US between 2000 and 2011.
Fix the agreement mistake
cinemas
Overall
, in spite of fluctuating, all figures ended up higher by the end of Linking Words
time
period given and people with 15-24 and 35 and over years old were consistently the most and the least attendees.
Add an article
the time
To begin
with, the graph for individuals in the range of 15-24 started at roughly 15 Linking Words
percent
, which Change the spelling
per cent
followed
by a slight rise to almost 32 in 2005, Add a missing verb
was followed
then
fluctuated widely during Linking Words
next
three years before increasing sharply to Correct article usage
the next
high
of 58 Add an article
a high
percent
somewhere in the vicinity of 2010. Change the spelling
per cent
Finally
, it reached Linking Words
at
52 by the end of 2011. Change preposition
apply
On the contrary
, nearly no one with Linking Words
35
and over Correct article usage
a 35
year
old population went to Fix the agreement mistake
years
Use synonyms
cinema
in 2000, which went up progressively to about 13 people Add an article
the cinema
a cinema
of
every 100Change preposition
out of
ones
.
As far as the remaining two age groups it concerned, their graph saw a similar trend compared to the former ones, starting at 10 and 4 for 7-14 and 25-35 respectively. With the exception of 2005 Correct pronoun usage
apply
where
the percentage of 25–35-year-old individuals passed the 7-14 ones, the popularity Correct word choice
when
Use synonyms
cinema
was lower among 25-35 than 7-14 before 2011, Change preposition
of cinema
However
, 30 percent of both groups preferred Linking Words
cinema
in 2011.Use synonyms