
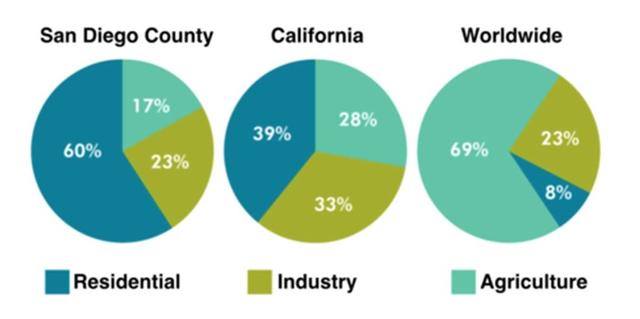
Three pie charts provide information on the use of water classified into three categories namely residential, industry, and cultivation in San Diego, California, and worldwide, measured in percentage.
Overall
, the water usage purposes in the two mentioned regions were dominated by residential, Linking Words
whereas
the rest of the world was preoccupied with agriculture.
Housing had the lion's share of San Diego's total water usage by 60, contrasting to agricultural irrigation with a mere 6 from the industrial occasions which accounted for more than half of the residential's ratio.
As a comparison, the proportion was more evenly distributed in California. Human habitats dominated its allocation with a 6% difference from industrial needs, Linking Words
while
horticulture took up 28% of the total number. Linking Words
On the other hand
, agriculture had a solid domination of other categories in other parts of the world where the number was tripled for industrial purposes which came second and left only 8% for residential usage.Linking Words