
The
line
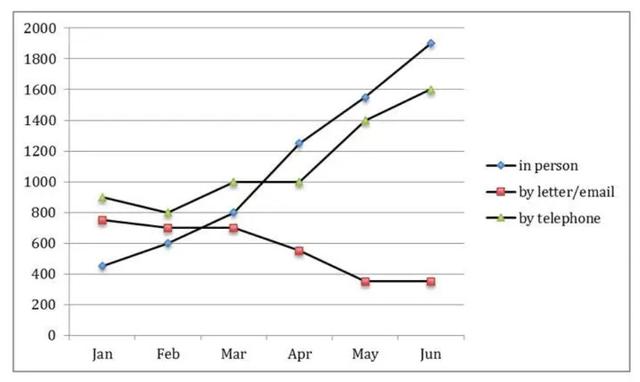
graph illustrates the Use synonyms
requests
for information at a visitor office in a nation during a half year. In general, Use synonyms
although
the Linking Words
number
of Use synonyms
requests
in person is the highest among these categories, the level of it by letter/email is the lowest. Use synonyms
Additionally
, both Linking Words
requests
in person and by telephone are a significant increase from the first year.
The Use synonyms
line
of Use synonyms
in-personperson
was the lowest Correct your spelling
in-person person
in-person-person
number
in January, at 400. Use synonyms
However
, the highest Linking Words
number
among the three figures is in person with nearly 2000 after 6 months. Use synonyms
In addition
, Linking Words
this
Linking Words
line
increased from 200 to 400 per month through these years.
The Use synonyms
line
of Use synonyms
requests
by telephone with approximately 1000 in January, which was the highest Use synonyms
number
, is a remarkable growth in June, at a second rate (1600). In marked contrast, the red Use synonyms
line
which by letter/email was the second highest Use synonyms
number
at around 800, is the lowest Use synonyms
number
in June at under 400Use synonyms