
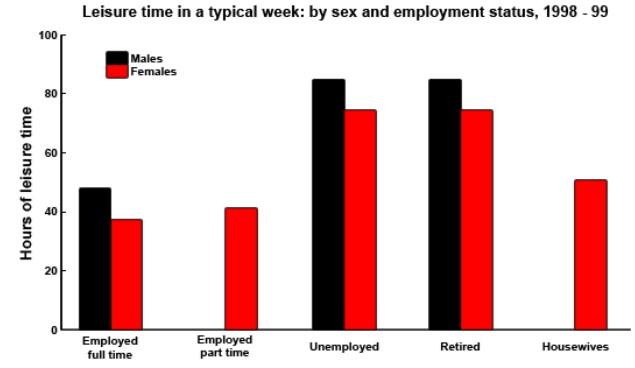
The bar chart depicts the number of leisure
hours
different people of a town spend on their pastimes in the year 2019. They are compared Use synonyms
accordingly
based on their gender and employment status.
Linking Words
Overall
, it is evident that males dominated women in regard to spending more time on their extra-curricular activities. Linking Words
While
there were no men, who were working as part-timers and as stay-at-home husbands, women were spread over in all different employment situations.
It is noticeable that the female population, who were full-time and part-time workers spent nearly 40 Linking Words
hours
Use synonyms
however
, as housewives, they spent about 50 Linking Words
hours
on their pastimes. Use synonyms
In addition
to Linking Words
this
, people who were unemployed and retired spent about 70 to 80 Linking Words
hours
on leisure activities no matter their gender. Use synonyms
While
fully-employed men had around 50 Linking Words
hours
of leisure time, females had less than 40 Use synonyms
hours
.
Use synonyms
Therefore
, Linking Words
it is clear that
people have a lot of free time to spend on their leisurely activities after their retirement.Linking Words