
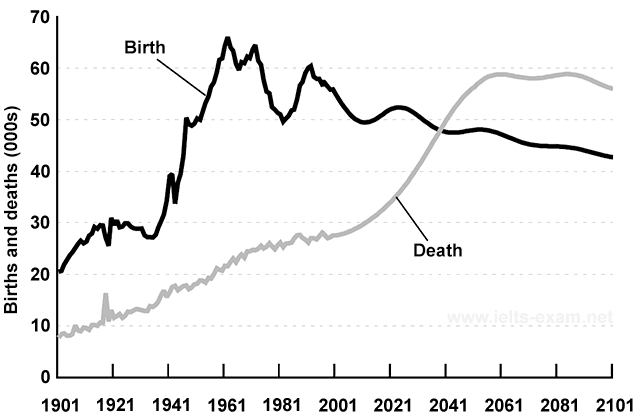
The graph illustrates patterns in the birth and death
rates
in New Zealand between 1901 and 2101.
Use synonyms
Overall
, the birth Linking Words
rates
have outnumbered the death Use synonyms
rates
but are expected to be taken over in around 2040. After the turnover, Use synonyms
while
the number of births is projected to continue to drop, deaths are anticipated to remain relatively stable after slight growth.
In 1901, new births began at 20,000 and continued to increase, peaking at around 65,000 in 1961, albeit with ups and downs during the 60 years. After fluctuations over the next five decades by 2021, the trend is predicted to settle into a decline for the next eighty years, reaching approximately 45,000 births in 2101.
Linking Words
Conversely
, the number of deaths has continued to grow from roughly 9,000 to 35,000 for the Linking Words
last
120 years. Linking Words
This
upward trend is estimated to continue and intersect with the declining trajectory of the birth Linking Words
rates
in 2040, at around 50,000. From 2061 onwards, Use synonyms
however
, deaths are expected to flatline at nearly 60,000.Linking Words